-
Products
- Local Securities
- China Connect
- Grade Based Margin
- Stock Borrowing & Lending
- IPO
- Stock Options
- Foreign Stocks
- Unit Trust
- Local Futures
- Foreign Futures
- Forex
- Bullion
- Insurance Services
- Bond
- Monthly Investment Plan
- Mortgage
- Other Services
- Surplus Cash Facility
- Phillip Premier
- Latest Insurance Promotion<
- ETF
- Smart Minor (Joint) Account
- Capital Management
- Research
- Market Info
- Education Center
- Phillip Apps
- Customer Service
- About Us
-
Surplus Cash Facility
Research Report
Standard Chartered PLC (2888.HK) - Buy SCB and Sell HSBC
Wednesday, March 13, 2013  13996
13996
Standard Chartered PLC(2888)
| Recommendation | Buy |
| Price on Recommendation Date | $207.500 |
| Target Price | $250.000 |
Weekly Special - 1810 Xiaomi
Highlights of FY 2012
Tenth consecutive year of record high in income and profit growth:
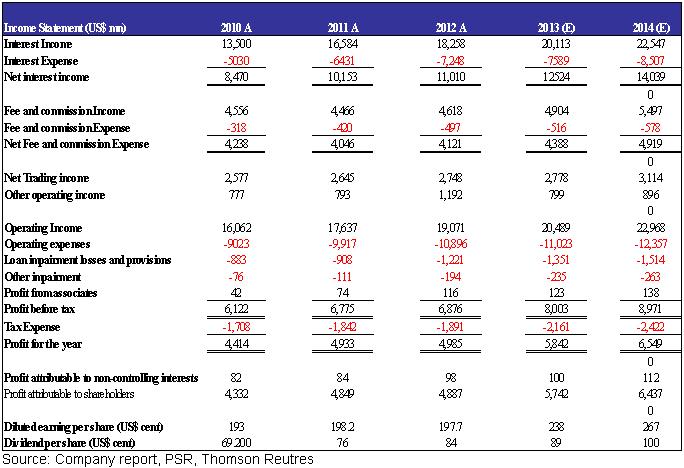
1) Operating income of 19.071billion,up 1.575 billion or 8% y/y
2) EBT of $ 6.876 billion, an increase of 1% y/y。
3) Annual dividend of 84 cents per share, up 10.5% y/y
4) EPS rose to 225.2 cents, up 13.7% y/y or 27.2 cents
5) Common shareholders` equity ROE was 12.8 %, up slightly by 0.6% y/y
6) Cost-effectiveness ratio was 53.8%,dropped slightly by 2.7% y/y
7) Group net interest margin to maintain the 2.3%
The Group recorded a tenth consecutive year new high in the profit of FY12,net profit of 4.985 billion USD (as below),up 1.05% y/y, NIM maintain at 2.3%, same as FY 11。The good result is mainly contributed by the proper balancing market strategy of development in emerging markets, especially in Asia, Africa and the Middle East market,Even the Asia-Pacific region contributing over 60% of the group's EBT, no country dominated the earning contribution over 20%, as Hong Kong is the major contributor in the area,only contributing about 20% of EBT or operating income. Meanwhile,26 markets delivered over 100 million of income and 25 markets grew at a double digit rate,diversifying the market risk and country risk .In addition, we expect some special expenses will no longer exist, such as the fines from U.S. regulators of 667 million. Thus, we enhance the investment rating to “Buy” and rise the target price to $250 HKD In our view, compared with HSBC, SCB had a better cost control and less claims involved, the core business was also better than HSBC in FY12. We expect the price performance of SCB is better than HSBC in short-term, we suggest clients to change their positions form HSBC to SCB.
Net Interest Income and Non Interest Income
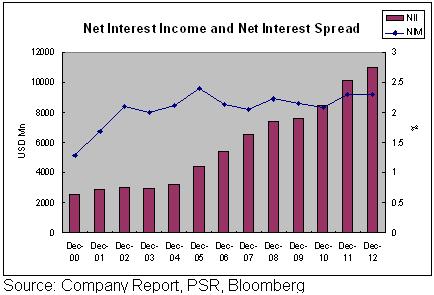
It was a record high net interest income (NII) of SCB in 2012, the net interest income reached 11.010 billion,rose 8% y/y,higher than our expectation slightly, the NIM maintained at 2.3%。Meanwhile the non-NII up 7.7% y/y to 8.061billion,mainly attributed by the growth in net trading income and other operating income which rose 4%and 50% respectively, better than our expectation.
The operating expenses of SCB rose 979 million or 10% y/y to 10.896billion,mainly due to the fines of 667 million, deducting these special expenses , the actual expenses was only increased 3% in 2012, reflecting a good cost control, better than our expectation.
Dividend Policy
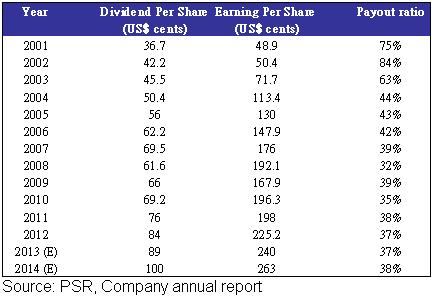
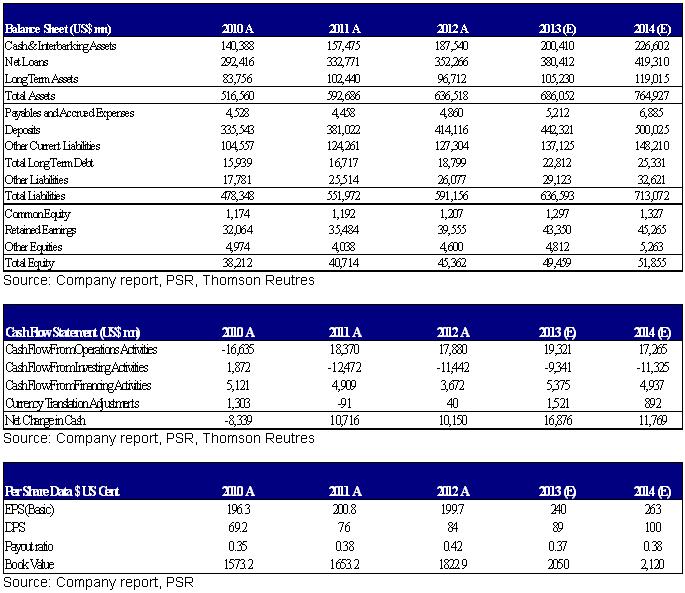
Dividend policy, the dividend rate of SCB was 37% in 2012. We expect the group will maintain the payout ratio at 30-40%, expected EPS of 2013 is 18.67 HKD, DPS of 2013 is 6.9 HKD, the dividend payout ratio can be maintained at 37%.
Operating Income distribution
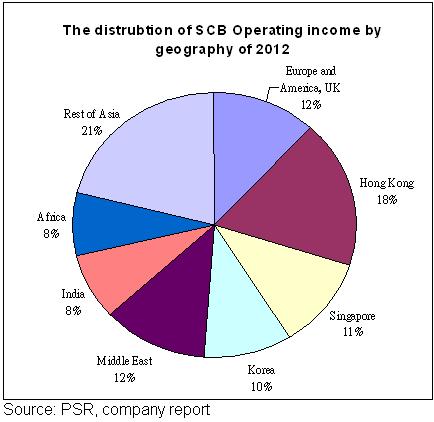
The Asia Pacific region distributed for about 60% of overall business, we expect China and ASEAN countries will be the growth generator in future. 26 markets delivered over 100 million of income and 25 markets grew at a double digit rate, with no country dominated the earning contribution over 20% diversifying market risk and country risk
Apart from that the corporate banking revenue from Africa reached 1 billion first time, revenue grew 10 % y/y, the revenue from MESA also grew 4% y/y, reflecting SCB group is not suffered from the money laundering allegations.
The group is the only major bank who are operating in all 10 ASEAN countries, the ASEAN countries enjoy 14% CAGR growth. The business of SCB in Indonesia, Malaysia, Thailand, Philippines and Vietnam, recorded an increase of 13%, 18%, 13%, 11% and 27%, respectively. India dropped significantly due to last year's gross domestic product (GDP), down to 5.2% from the five-year growth averages 7.9%, revenue and profit fell by 12% and 16%, respectively.
Risk
1. The Fed stop QE policy
2. The amounts of fines are out of expectation
3. Monitoring cost surge significantly
4. Income growth declining in emerging market
Valuation
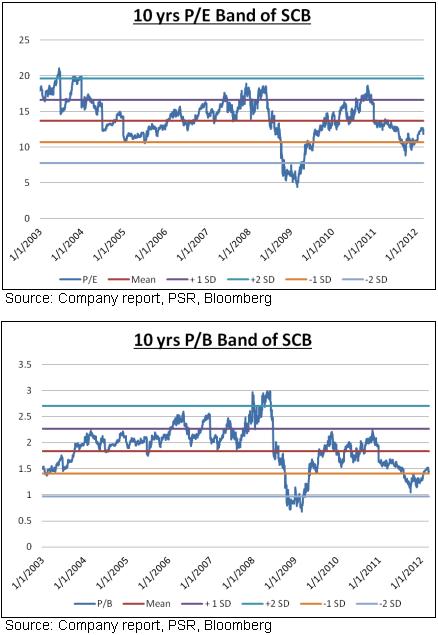
The P/B of SCB is trading at nearly 1.5 times, close to the 10-year average minus one standard deviation, as the group focus on the emerging markets, enjoying a higher valuation when comparing from its peers, with the cost-benefit ratio is better than its peers, and capital adequacy ratio in line with our expectations, enhance the investment rating to "buy" rating and rose target price to $250 HKD. Expected P/E about 13x and expected P/B about 1.8X, which is near the mean of last 10 years..
Financial Status
Peers

This report is produced and is being distributed in Hong Kong by Phillip Securities Group with the Securities and Futures Commission (“SFC”) licence under Phillip Securities (HK) LTD and/ or Phillip Commodities (HK) LTD (“Phillip”). Information contained herein is based on sources that Phillip believed to be accurate. Phillip does not bear responsibility for any loss occasioned by reliance placed upon the contents hereof. The information is for informative purposes only and is not intended to or create/induce the creation of any binding legal relations. The information provided do not constitute investment advice, solicitation, purchase or sell any investment product(s). Investments are subject to investment risks including possible loss of the principal amount invested. You should refer to your Financial Advisor for investment advice based on your investment experience, financial situation, any of your particular needs and risk preference. For details of different product's risks, please visit the Risk Disclosures Statement on http://www.phillip.com.hk. Phillip (or employees) may have positions/ interests in relevant investment products. Phillip (or one of its affiliates) may from time to time provide services for, or solicit services or other business from, any company mentioned in this report. The above information is owned by Phillip and protected by copyright and intellectual property Laws. It may not be reproduced, distributed or published for any purpose without prior written consent from Phillip.
Top of Page
|
Please contact your account executive or call us now. Research Department Tel : (852) 2277 6846 Fax : (852) 2277 6565 Email : businessenquiry@phillip.com.hk Enquiry & Support Branches The Complaint Procedures |
About Us Phillip Securities Group Join Us Phillip Network Phillip Post Phillip Channel Latest Promotion 新闻稿 |
E-Check Login |
Investor Notes Free Subscribe |

|


